1 DIMENSIONAL, ENVIRONMENTAL AND POWER SUPPLY SPECIFICATIONS
|
1.1 DIMENSIONAL
|
| Nominal Dimensions |
137mmH x 248mmW x 284mmD (5.4″ x 9.75″ x 11.2″) with feet not |
| Nominal Weight |
extended 3.2kg (71b) net, 5kg (11lb) shipping |
1.2 ENVIRONMENTAL
|
| Storage Environment |
-20 to 75C (-4 to 167F) (non-condensing) |
| Operating Environment |
0 to 40C (32 to 104F), <85% RH (non-condensing), Pollution |
| Operating Altitude |
Degree 2 0 to 2000m (6560ft) ASL |
1.3 POWER SUPPLY
|
| Line Power |
Installation Category II; 85-264Vrms, 45 to 65Hz, 40VA max. Internally fused with a non-user serviceable fuse |
2 ELECTRICAL CHANNEL INPUT AND ACCURACY SPECIFICATIONS
|
| Note: All percentages are % of reading unless otherwise described. |
2.1 INPUT ISOLATION SPECIFICATIONS
|
| Valid for any V terminal to PXe-2640 chassis ground; any A terminal to PXe-2640 chassis ground; and between any V and any A terminal. |
| Impedance |
>1GΩ II <30pF |
| Max. Voltage |
4500VP< max without damage
2500V”MS max for <1s without damage
1OOOV”MS max continuous rated working voltage (CAT I/
II) 600VRMs max continuous rated working voltage (CAT
Ill) 300VRMs max continuous rated working voltage (CAT
IV) |
2.2 VOLTAGE MEASUR EMENT SPECIFICATIONS
|
| The specifications for voltage are independent of the current input option installed in the respective channel. |
2.2.1 VOLTAGE INPUT CAPABILITY AND CHARACTERISTICS
|
| Specification |
S Channel Type |
A Channel Type |
L Channel Type |
W Channel Type |
| No Damage Voltage Range |
<1ms |
| <100ms |
| <5S |
| Continuous |
| XT2640 |
|
<3000VRMS and VPK |
<500VRMS and 3000VPK |
<3000VRMS and VPK |
| <2000VRMS |
<300VRMS |
<1500VRMS |
| <1500VRMS |
<250VRMS |
<1000VRMS |
| <1000VRMS |
<160VRMS |
<650VRMS |
| As above |
| Measurable Voltacie Rancie |
Unpowered |
|
<1803VRMS and VPK |
<182.3VRMS and VPK |
<1803RMS and VPK |
| Specified Voltacie Rancie |
<1OOOVRMS and <1750VPK |
<160VRMS and <175VPK |
<65OVRMS and <1750VPK |
| Impedance Burden |
1.201MΩ ± 0.25% |
121kΩ ± 0.25% |
399.5kΩ ± 0.25% |
| 3dB Bandwidth(typical) |
900kHz |
3MHz |
|
2.2.2 VOLTAGE MEASUREMENT ACCURACY
|
| The charts below show guaranteed maximum voltage errors for DC, MAINS, AV IONICS, and 50kHz throughout a 1V to 1000V range of applied voltages expressed as % of reading and are va lid within ±5C of the ca libration temperature (add 0.005% per C beyond this) and where no significant common-mode is present. Following the charts is a table which can be used to calculate the guaranteed accuracies for applications other than shown in the charts and also for the computation of numerical errors. |
2.2.2.1 PRIMARY VOLTAGE MEASUREMENT ACCURACY TABLE
|
| Add relevant errors from the table below for the maximum error in primary voltage measurements (e.g. DC, AC, AC +DC, Rectified, Peak, Valley, Peak-Valley). |
MAXIMUM SCALING ERRORS
Apply to all results as shown below as a percentage of the reading
If signal contains significant levels at multiple frequencies , apply to each level & frequency |
| Specification |
S Channel Type |
A Channel Type |
L Channel Type |
W Channel Type |
Base Scaling Error
Apply to all results |
0.1% |
0.03% |
0.1%
(0.2 % if 2ms LF/PERIOD) |
Frequency Dependent Scaling Error
Apply to all results other than DC or MAINS |
AVIONICS |
| LF or VLF |
| <10kHz |
| 10k-40kHz |
| 40k-100kHz |
| 100k-1MHz |
| >1MHz |
|
None |
0.005% |
None |
| 0.01% |
0.05% |
| F*0.005% |
F*0.002% |
| 0.05%+(F-10)*0.012% |
| 0.41 %+1F-40\*0.025 % |
0.08 %+1F-40\*0.004 % |
| Typically (F/1000)2*100% |
0.32 %+(F-100)*0.013% |
| Not specified |
Typically (F/3500)2*100% |
Self-Heating Scaling Error
Apply to all results (only significant at higher voltaaesl 1 minute nominal time constant |
0.05%*(VAC+DC/ 1000)2 |
0.5 %*(VAC+DC/1000)2 |
0.15 %*(VAC+DC/1000)2 |
Temperature Scaling Error
Apply to all results if outside of ±5C from calibration temperature |
0.005% per C outside of ±5C from calibration temperature |
| Bandwidth Limit Scaling Error Apply if usina USER bandwidth settina |
10%*(F/FBW)2, unspecified for F > 0.3*FBW |
MAXIMUM FLOOR ERRORS
Apply to all results as shown below in Volts (generally only significant at low input |
| Specification |
S Channel Type |
A Channel Type |
L Channel Type |
W Channel Type |
Base Floor Error
Apply to all results |
1.8mV |
450µV |
45µV |
1.8mV |
DC Floor Error
Apply to DC and RECTIFIED results
Apply to AC+DC results after multiplying by VDC/VAC+DC |
3mV |
1mV |
100µV |
5mV |
AC Floor Error
Apply to AC, AC+DC, and RECTIFIED results |
MAINS. LF. VLF & FBW<10kHz |
| AVIONICS & FBW<50kHz |
| Otherwise |
|
100µV/VRDG |
100µV/VRDG |
4µV/VRDG |
200µV/VRDG |
| 300µV/VRDG |
300µV/VRDG |
8µV/VRDG |
650µV/VRDG |
| 1.1mV/VRDG |
1.1mV/VRDG |
11µV/VRDG |
1.5mV/VRDG |
Peak Floor Error
Apply to PK, VLY and PK-VLY results |
MAINS. LF. VLF & FBW<10kHz |
| AVIONICS & FBW<50kHz |
| Otherwise |
|
40mV |
40mV |
8mV |
60mV |
| 75mV |
75mV |
11mV |
125mV |
| 125mV |
125mV |
17mV |
175mV |
Common Mode Error
Apply to AC, AC+DC, and RECTIFIED results Apply using voltage on V LO terminal relative to chassis ground. Error has 90′ phase shift to common-mode voltage |
1µV per V.Hz
(11.5mV@230V/50Hz) |
1OOnV per V.Hz
(1.15mV@230V/50Hz) |
700nV per V.Hz
(8.05mV@230V/50Hz) |
Adjacent Channel Error
Apply to AC, AC+DC, and RECTIFIED results
Apply using adjacent channel A LO or V LO terminal voltage relative to chassis ground. Error has 90′ phase shift to adjacent channel voltage |
300nV per V.Hz
(3.45mV@230V/50Hz) |
30nV per V.Hz
(345µV@230V/50 Hz) |
210nV per V.Hz
(2.415mV@230V/50Hz) |
|
2.2.2.2 SECONDARY VOLTAGE MEASUREMENT ACCURACY TABLE
|
| Specification |
S Channel Type |
A Channel Type |
L Channel Type |
W Channel Type |
| Crest Factor Error |
(Total Floor Error from preceding table for PK results)/VAC |
| Form Factor Error |
(fatal Flaar Error from preceding table for AC+DC results)/VRECTIFIED |
Inter-Channel Error
For 120° between equal amplitudes |
(Relevant Voltage Errors from preceding table at the inter-channel voltage) + 0.0015%*F |
| Harmonic or Spectrum Error |
|
| <10kHz |
| 10k-115kHz |
| 115k-435kHz |
|
AC Voltage Errors from preceding table at V and F of the harmonic or spectrum point
+ (H/ N)2*0.3% of reading
+ (if not fundamental) from below using the frequency of the harmonic or spectrum point |
| 0.01% of VAC+DC |
0.006% of VAC+DC |
0.015% of VAC+DC |
| 0.05% of VAC+DC |
0.03% of VAC+DC |
| Not Available |
0.08% of VAC+DC |
| Inter-Channel Fundamental Phase Error |
0.02°+0.15°*F |
0.01°+0.07°*F |
| Harmonic-Fundamental Phase Error (typical, BANDWIDTH configured as UNFILTERED) |
0.02°+0.1°*F+0.001°*H |
0.02°+0.03°*F+0.001°*H |
| %THO Error Errors shown are all expressed in % THD units |
|
| <10kHz |
| 10k-115kHz |
| 115k-435kHz |
|
(0.005+0.000025*N)*% THD+0.00005*N*✓N
+ from below usina the frequency of highest included harmonic |
| 0.025+ 1.25/VAC |
0.015+1/VAC |
0.015+0.2/ |
0.03+ 1.5/VAC |
| VAC 0.15+3.5/VAC |
0.15 |
0.06+ 4/VAC |
| +0.35/VAC Not Available |
0.15+4/VAC |
|
2.3 CURRENT MEASUREMENT SPECIFICATIONS
|
2.3.1 CURRENT INPUT CAPABILITY AND CHARACTERISTICS
|
| Specification |
Channal Type |
Option H |
Option D HI Range or Auto-Range when on HI Range |
Option D LO Range or Auto-Range when on LO Range |
Option X HI Range |
Option X LO Range |
| No Damage Current Range |
<8ms |
| <40ms |
| <1s |
| Continuous |
| XT2640 Unpowered |
|
All |
<200ARMS and <300APK |
<150ARMS and <250APK |
<60ARMS and <150APK |
<200VRMS and <300VPK |
<20VRMS and <30VPK |
| All |
<75ARMS |
<50ARMS |
<40ARMS |
<50VRMS |
<10VRMS |
| All |
<50ARMS |
<30ARMS |
<5ARMS |
<30VRMS |
<5VRMS |
| All |
<30ARMS |
<20ARMS |
<2ARMS |
<25VRMS and VPK |
<5VRMS and VPK |
| All |
As Above |
<2VRMS and <150VPK |
<25VRMS and <300VPK |
| Measurable current Range |
All |
<225ARMS and APK |
<150ARMS and APK |
<1.02ARMS and APK |
<23.1VRMS and VPK |
<0.576VRMS and VPK |
| Specified Current Range |
All |
<30ARMS and <200APK |
<20ARMS and <140APK |
<1ARMS and APK |
<15VRMS and <20VPK |
<0.55VRMS and VPK |
| Impedance Burden |
All |
2.5mΩ to 7mΩ |
4mΩ to 12mΩ |
0.562Ω ± 0.75mΩ |
20.5KΩ ± 0.25% |
10.25KΩ ± 0.25% |
| 3dB Bandwidth (typical) |
S, A or L |
1.25MHz |
| W |
5MHz |
3MHz |
|
2.3.2. CURRENT MEASUREMENT ACCURACY
|
| The charts below show guaranteed maximum current errors for DC, MA INS, AV IONICS, and 50kHz throughout a 1OOµA to 30A range of applied currents expressed as % of reading and are valid within ±5C of the calibration temperature (add 0.005% per C beyond this) and where no significant common-mode is present. Following the charts is a table which can be used to calculate |
2.3.2.1 PRIMARY CURRENT MEASUREMENT ACCURACY TABLE
|
| Add relevant errors from the table below for the maximum error in primary current measurements (e.g. DC,AC, AC+ DC, Rectified, Peak, Valley, Peak-Valley). |
MAXIMUM SCALING ERRORS
Apply to all results as shown below as a percentage of the reading
If signal contains significant levels at multiple frequencies , apply to each level & frequency |
| Specification |
Channel Type |
Option H |
Option D HI Range |
Option D LO Range |
Option X HI Range |
Option X LO Range |
Base Scaling Error
Apply to all results |
A or L |
0.03% |
| S or W |
0.1% (0.2% if 2ms LF/PERIOD) |
Frequency Dependent Scaling Error
Apply to all results other than DC or MAINS |
LF or VLF |
| AVIONICS |
| <10kHz |
| 10k-40kHz |
| 40k-100kHz |
| 100k-1MHz |
| >1MHz |
|
S,A or L |
0.01% |
| W |
0.05% |
| A or L |
0.002% |
| S or W |
None |
| S,A or L |
F*0.003% |
| W |
F*0.0015% |
| S,A or L |
0.03%+(F-10)*0.007% |
| W |
F*0.0015% |
| S,A or L |
0.24%+(F-40)*0. 02% |
| W |
0.06%+(F-40)*0.003% |
0.06 %+(F-40)*0 .004% |
| S,A or L |
Typically (F/ 1250)2*100% |
| W |
0.24%+(F-100)*0.012% |
0.3%+(F-100)*0. 015% |
| W |
Typically (F/5000)2*100% |
Typically (F/3000)2*100% |
Self-Heating Scaling Error
Apply to all results (only significant at higher currents) 3 minute nominal time constant |
All |
0.00015%*AAC+DC2 |
0.0002%*AAC+DC2 |
None |
Temperature Scaling Error
Apply to all results if outside of ±5C from calibration temperature |
All |
0.005% per C outside of ±5C from calibration temperature |
| Bandwidth Limit Scaling Error Apply if usina USER bandwidth setting |
All |
10%*(F FBW)2, unspecified above 0.3*FBW |
MAXIMUM FLOOR ERRORS
Apply to all results as shown below in Amps (generally only significant at low input |
| Specification |
Channel Type |
Option H |
Option D HI Range |
Option D LO Range |
Option X HI Range |
Option X LO Range |
Base Floor Error
Apply to all results |
A or L |
56µA |
38µA |
250nA |
6µV |
150nV |
| S or W |
225µA |
150µA |
1µA |
23µV |
600nV |
DC Floor Error
Apply to DC and RECTIFIED results
Apply to AC+DC results after multiplying by VDC/VAC+DC |
A or L |
0.23mA |
0.15mA |
1µA |
40µV |
5µV |
| S |
0.45mA |
0.3mA |
2µA |
80µV |
6µV |
| W |
0.68mA |
0.45mA |
3µA |
120µV |
8µV |
AC Floor Error
Apply to AC, AC+DC, and RECTIFIED results |
MAINS. LF. VLF & FBW<10kHz |
| AVIONICS & FBW<50kHz |
| Otherwise |
|
S,A or L |
3.3µA/ARDG |
1.5µA/ARDG |
90pA/ARDG |
35nV/ARDG |
20pV/ARDG |
| W |
5µA/ARDG |
2.5µA/ARDG |
125pA/ARDG |
50nV/ARDG |
50pV/ARDG |
| S,A or L |
33µA/ARDG |
15µA/ARDG |
0.9nA/ARDG |
350nV/ARDG |
200pV/ARDG |
| W |
50µA/ARDG |
25µA/ARDG |
1.25nA/ARDG |
500nV/ARDG |
500pV/ARDG |
| S,A or L |
330µA/ARDG |
150µA/ARDG |
9nA/ARDG |
3.5µV/ARDG |
200nV/ARDG |
| W |
500µA/ARDG |
250µA/ARDG |
12.5nA/ARDG |
5µV/ARDG |
5nV/ARDG |
Peak Floor Error
Apply to PK, VLY and PK-VLY results |
MAINS. LF. VLF & FBW<10kHz |
| AVIONICS & FBW<50kHz |
| Otherwise |
|
S,A or L |
8mA |
5mA |
40µA |
0.75mV |
25µV |
| W |
10mA |
6.5mA |
50µA |
0.9mV |
30µV |
| S,A or L |
25mA |
17mA |
125µA |
2.5mV |
65µV |
| W |
30mA |
20mA |
150µA |
3mV |
80µV |
| S,A or L |
75mA |
50mA |
400µA |
7.5mV |
200µV |
| W |
90mA |
60mA |
500µA |
10mV |
250µV |
Common Mode Error
Apply to all results
Apply using voltage on A LO terminal relative to chassis ground. Error has 90° phase shift to common-mode voltage |
All |
500pA per V.Hz
(5.75µA@230V/50 Hz) |
400pA per V.Hz
(4.6µA@230V/50Hz) |
20pA per V.Hz
(0.23µA@230V/50Hz) |
15nV per V.Hz
(0.172mV@230V/50Hz) |
0.5nV per V.Hz
(5.75µV@230V/50Hz) |
Adjacent Channel Error
Apply to all results
Apply using adjacent channel A LO or V LO terminal voltage relative to chassis ground. Error has 90° phase shift to adjacent channel voltage |
All |
150pA per V.Hz
(1.725µA@230V/50Hz) |
120pA per V.Hz
(1.38µA@230V/50Hz) |
7pA per V.Hz
(80.5nA@230V/50Hz) |
7nV per V.Hz
(80.5µV@230V/50 Hz) |
0.2nV per V.Hz
(2.3µV@230V/50Hz) |
|
2.3.2.2 SECONDARY CURRENT MEASUREMENT ACCURACY TABLE
|
| Specification |
Channel Type |
Option H |
Option D HI Range |
Option D LO Range |
Option X HI Range |
Option X LO Range |
| Crest Factor Error |
All |
(Total Current Floor Error from preceding table for PK results)/AAC |
| Form Factor Error |
All |
(Total Current Floor Error from preceding table for AC+DC results)/ARECTIFIED |
Multi-Channel Error
For similar current level and phase in each phase. |
AN (2θ3w) |
| AθC (3θ3w 2ch) |
| AN (3θ4w) |
|
All |
Relevant Current Errors from preceding table for AθA
+ Relevant Current Errors from preceding table for
AθB + 0.0005% of (AθA + AθB)*F |
| All |
Relevant Current Errors from preceding table for AθA
+ Relevant Current Errors from preceding table for
AθB + 0.0015% of (AθA + AθB)*F |
| All |
Relevant Current Errors from preceding table for AθA
+ Relevant Current Errors from preceding table for
AθB + Relevant Current Errors from preceding table
for AθC + 0.0015% of (AθA + AθB + AθC)*F |
| Harmonic or Spectrum Error |
|
| <10kHz |
| 10k-115kHz |
| <10kHz |
| 10k-115kHz |
| <10kHz |
| 10k-115kHz |
| 115k-435kHz |
|
All |
AC Current Errors from preceding table at A and F of the harmonic or spectrum point
+ (H/N)2″0.3% of reading
+ (if not fundamental) from below using the frequency of the harmonic or spectrum Point |
| A or L |
0.006% of AAC+DC |
| 0.05% of AAC+DC |
| S |
0.01% of AAC+DC |
| 0.05% of AAC+DC |
| W |
0.015% of AAC+DC |
| 0.03% of AAC+DC |
| 0.08% of AAC+DC |
Current· Voltage
Fundamental Phase Error |
S, A or L |
0.005° + 0.015°*F |
| W |
0.005° + 0.007°*F |
| Harmonic-Fundamental Phase Error (typical, BANDWIDTH configured as UNFILTERED |
S, A or L |
0.02°+0.1°*F+0.001°*H |
| W |
0.02°+0.03°*F+0.001°*H |
| %THO Error Errors shown are all expressed in %THO units. |
|
| <10kHz |
| 10k-115kHz |
| <10kHz |
| 10k-115kHz |
| <10kHz |
| 10k-115kHz |
| 115k-435kHz |
|
All |
(0.005+0.000025*N)*%THD+0.00005 *✓N
+ from below using the frequency of highest included harmonic |
| A or L |
0.015+0.2/AAC |
0.015+0.15/AAC |
0.015+0.001/AAC |
0.015+0.025/AAC |
0.015+0.0006/AAC |
| 0.15+2/AAC |
0.15+1.5/AAC |
0.15+0.01/AAC |
0.15+0.25/AAC |
0.15+0.006/AAC |
| S |
0.025+0.2/AAC |
0.025+0.15/AAC |
0.025+0.001/AAC |
0.025+0.025/AAC |
0.025+0.0006/AAC |
| 0.15+2/AAC |
0.15+1.5/AAC |
0.15+0.01/AAC |
0.15+0.25/AAC |
0.15+0.006/AAC |
| W |
0.03+0.25/AAC |
0.03+0.18/AAC |
0.03+0.0012/AAC |
0.03+0.03/AAC |
0.03+0.001/AAC |
| 0.06+2 .5/AAC |
0.06+1.8/AAC |
0.06+0.012 /AAC |
0.06+0.3/AAC |
0.06+0.01/AAC |
| 0.15+2.5/AAC |
0.15+1.8/AAC |
0.15+0.012/AAC |
0.15+0.3/AAC |
0.15+0.01/AAC |
|
2.4 WATTS, VAR AND VA MEASUREMENT SPECIFICATIONS
|
| The charts below show guaranteed maximum Watts errors for DC, MAINS, AV IONICS, and 50kHz from 1OOµW up to the highest available using a D option current measurement (H and X option current accuracies are similar within their respective range of currents and are not shown for clarity), expressed as % of Watts reading and are va lid within ±5C of the calibration temperature (add 0.005% per C beyond this) and where no significant common-mode is present. Following the charts is a table which can be used to calculate the guaranteed accuracies for applications other than shown in the charts and also for the computation of |
2.4.1 WATIS, VAR AND VA MEASUREMENT SPECIFICATIONS
|
2.4.1.1 PRIMARY WATIS, VAR AND VA MEASUREMENT ACCURACY TABLE
Add relevant errors from the table below for the maximum error in all Watts, VA and VAR measurements except harmonic Watts.
Note that by definition DC Watts and DC VA are identical, and DC VAR is zero |
MAXIMUM SCALING ERRORS
Apply to alI results as shown below as a percentage of the reading
If signal contains significant levels at multiple frequencies, apply to each level & |
| Specification |
Channel Type |
Option H |
Option D HI Range |
Option D LO Range |
Option X HI Range |
Option X LO Range |
Base Scaling Error
Apply to all results |
A or L |
0.045% |
| S or W |
0.15% (0.3% if 2ms LF/PERIOD) |
Frequency Dependent Scaling Error
Apply to AC component of all results other than DC or MAINS |
LF or VLF |
| AVIONICS |
| <10kHz |
| 10k-40kHz |
| 40k-100kHz |
| 100k-1MHz |
| >1MHz |
|
S,A or L |
0.01% |
| W |
0.05% |
| A or L |
0.005% |
| S or W |
None |
| S,A or L |
F*0.006% |
| W |
F*0.0025% |
| S,A or L |
0.06%+(F-10)*0.0014% |
| W |
F*0.0025% |
| S,A or L |
0.48%+(F-40)*0.032% |
| W |
0.01%+(F-40)*0.005% |
0.01%+(F-40)*0.0055% |
| S,A or L |
Typically (F/1100)2*150% |
| W |
0.4%+(F-100)*0.018% |
0.43%+(F-100)*0.02% |
| W |
Typically (F/5000)2*150% |
Typically (F/3000)2*150% |
Self-Heating Scaling Error
Apply as % of Power reading to all results using voltage and current Self- Heating Errors from orevious tables |
All |
Add Voltage and Current Self-Heating Errors |
Temperature Scaling Error
Apply to all results if outside of ±5C from calibration tempperature |
All |
0.005% per C outside of ±5C from calibration temperature |
| Bandwidth Limit Scaling Error Apply to AC component of alI results if using USER bandwidth setting |
All |
20%*(F/FBW)2, unspecified above 0.3*FBW |
MAXIMUM FLOOR ERRORS
Apply to all results as shown below in Watts, VA or VAR as applicable (generally only significant at low input |
| Specification |
Channel Type |
Option H |
Option D HI Range |
Option D LO Range |
Option X HI Range |
Option X LO Range |
Base Floor Error
Apply to all results |
L |
(VAC+DC*56µA) + (AAC+DC*45µV) |
(VAC+DC*38µA) + (AAC+DC*45µV) |
(VAC+DC*250nA) + (AAC+DC*45µV) |
(VAC+DC*6µA) + (AAC+DC*45µV) |
(VAC+DC*0.15µA) + (AAC+DC*45µV) |
| A |
(VAC+DC*56µA) + (AAC+DC*450µV) |
(VAC+DC*38µA) + (AAC+DC*450µV) |
(VAC+DC*250nA) + (AAC+DC*450µV) |
(VAC+DC*6µA) + (AAC+DC*450µV) |
(VAC+DC*0.15µA) + (AAC+DC*450µV) |
| S or W |
(VAC+DC*225µA) + (AAC+DC*1.8mV) |
(VAC+DC*150µA) + (AAC+DC*1.8mV) |
(VAC+DC*1µA) + (AAC+DC*1.8mV) |
(VAC+DC*23µA) + (AAC+DC*1.8mV) |
(VAC+DC*0.6µA) + (AAC+DC*1.8mV) |
DC Floor Error
Apply to DC and AC+DC results using the Voltage and Current DC Floor Errors from previous tables |
All |
(VDC*Current DC Floor Error) + (ADC*Voltage DC Floor Error) + (Current DC Floor Error*Voltage DC Floor Error) |
| AC Floor Error (VA and VAR only) Apply to AC and AC+DC VA & VAR results using voltage and current AC Floor Errors from previous tables |
All |
(VAC*Current AC Floor Error) + (AAC*Voltage AC Floor Error) |
| Common Mode Error (VA and VAR only) Apply to AC component of VA and VAR results using the Voltage and Current Common Mode Errors from previous tables. |
All |
(VAC*Current Common Mode Error) + (AAC*Voltage Common Mode Error) |
| Common Mode Error (Watts only) Apply to AC component of Watts results using the Voltage Common Mode Error from previous table |
All |
(AAC*Voltage Common Mode Error) |
| Adjacent Channel Error Apply to AC component of all results using the Voltage and Current Adjacent Channel Errors from previous tables |
All |
(VAC*Current Adjacent Channel Error) + (AAC*Voltage Adjacent Channel Error) |
| Phase Floor Error (Watts only) Apply to AC and AC+DC Watts results |
s, A or L |
VAFUND*(PFFUND – cos(cos-1(PFFUND) + 0.015 F))
Alternately, as a worst case (at PF=O) this can expressed as F*0.028% of VA |
| W |
VAFUND*(PFFUND – cos(cos-1(PFFUND) + 0.007°*F))
Alternately ,as a worst case (at PF=O) this can expressed as F*0.013% of VA |
|
2.4.1.2 HARMONIC WATTS MEASUREMENT ACCURACY TABLE
|
| Specification |
Channel Type |
Option H |
Option D HI Range |
Option D LO Range |
Option X HI Range |
Option X LO Range |
| Harmonic or Spectrum Error |
|
| <10kHz |
| 10k-115kHz |
| <10kHz |
| 10k-115kHz |
| <10kHz |
| 10k-115kHz |
| 115k-435kHz |
|
All |
AC Watts Errors other than Phase Floor Error from preceding table at levels and F of the harmonic or spectrum point + (H/N)2*0.5% of reading
+ from below using the frequency of the harmonic or spectrum point |
| A or L |
0.006% + (0.004%+0.028%*F)/PF |
| 0.05% + (0.004%+0.028%*F)/PF |
| S |
0.01% + (0.004%+0.028%*F)/PF |
| 0.05% + f0.004%+0.028%*Fl/PF |
| W |
0.015% + (0.004%+0.013%*F)/PF |
| 0.03% + (0.004%+0.013%*F)/PF |
| 0.08% + f0.004%+0.013%*Fl/PF |
|
2.5.1 PF MEASUREMENT ACCURACY TABLE
|
Add relevant errors from the table below tor the maximum error in PF measurements. For PFFUND apply only the Base Floor and Phase Errors.
Note: DC PF is 1.0 by definition and has no error; the table below applies to AC, AC+DC and FUND PF results. |
| Specification |
Channel Type |
Option H |
Option D HI Range |
Option D LO Range |
Option X HI Range |
Option X LO Range |
| Base Floor Error Apply to all PF results |
L |
(56µA/AAC+DC) + (45µV/VAC+DC) |
(38µA/AAC+DC) + (45µV/VAC+DC) |
(250nA/AAC+DC) + (45µV/VAC+DC) |
(6µA/AAC+DC) + (45µV/VAC+DC) |
(0.15µA/AAC+DC) + (45µV/VAC+DC) |
| A |
(56µA/AAC+DC) + (450µV/VAC+DC) |
(38µA/AAC+DC) + (450µV/VAC+DC) |
(250nA/AAC+DC) + (450µV/VAC+DC) |
(6µA/AAC+DC) + (450µV/VAC+DC) |
(0.15µA/AAC+DC) + (450µV/VAC+DC) |
| S or W |
(225µA/AAC+DC) + (1.8mV/VAC+DC) |
(150µA/AAC+DC) + (1.8mV/VAC+DC) |
(1µA/AAC+DC) + (1.8mV/VAC+DC) |
(23µA/AAC+DC) + (1.8mV/VAC+DC) |
(0.6µA/AAC+DC) + (1.8mV/VAC+DC) |
| AC Floor Error Apply to all PF results using voltage and current AC Floor Error from previous tables this error always causes a reduced PF reading |
All |
-PFRDG*((Current AC Floor Error/ARDG) + (Voltage AC Floor Error/VRDG)) |
| DC Floor Error Apply to AC+DC PF result after multiplying by (1-PF) |
L |
(0.23mA/AAC+DC) + (0.1mV/VAC+DC) |
(0.15mA/AAC+DC) + (0.1mV/VAC+DC) |
(1µA/AAC+DC) + (0.1mV/VAC+DC) |
(40µA/AAC+DC) + (0.1mV/VAC+DC) |
(5µA/AAC+DC) + (0.1mV/VAC+DC) |
| A |
(0.23mA/AAC+DC) + (1mV/VAC+DC) |
(0.15mA/AAC+DC) + (1mV/VAC+DC) |
(1µA/AAC+DC) + (1mV/VAC+DC) |
(40µA/AAC+DC) + (1mV/VAC+DC) |
(5µA/AAC+DC) + (1mV/VAC+DC) |
| S |
(0.45mA/AAC+DC) + (3mV/VAC+DC) |
(0.3mA/AAC+DC) + (3mV/VAC+DC) |
(2µA/AAC+DC) + (3mV/VAC+DC) |
(80µA/AAC+DC) + (3mV/VAC+DC) |
(6µA/AAC+DC) + (3mV/VAC+DC) |
| W |
(0.68mA/AAC+DC) + (5mV/VAC+DC) |
(0.45mA/AAC+DC) + (5mV/VAC+DC) |
(3µA/AAC+DC) + (5mV/VAC+DC) |
(120µA/AAC+DC) + (5mV/VAC+DC) |
(8µA/AAC+DC) + (5mV/VAC+DC) |
| Phase Error Apply to all PF results |
S, A or L |
(PFFUND – cos(cos-1(PFFUND) ± 0.015°*F))
Alternately, as a worst case (at PF=O) this can expressed as F*0.00028 |
| W |
(PFFUND – cos(cos-1(PFFUND) ± 0.007°*F))
Alternately, as a worst case (at PF=O) this can expressed as F*0.00013 |
|
3.3 ANALOG INPUT MEASUR EMENT SPECIFICATIONS
|
| Maximum Input Error |
0.05% + 1mV
Add (0.005% + 50µV) per C outside of ±5C from calibration temperature |
4 ANALYSIS SPECIFICATIONS
|
4.1 INTEGRATION SPECIFICATIONS
|
| Start Delay Time |
Zero to 99 days, 99 hours, 99 minutes, 99 seconds (1 second resolution) 0.01% + 8ms maximum error |
| Integration Time |
Manual{unrestricted period of time),or 1 second to 99 days), 99 hours, 99 minutes, 99 seconds 0.01% + lms maximum error |
| Maximum Data |
{0.01% + 1ms) (not for integrated average data) {0.03/measurement period in seconds)% per year error |
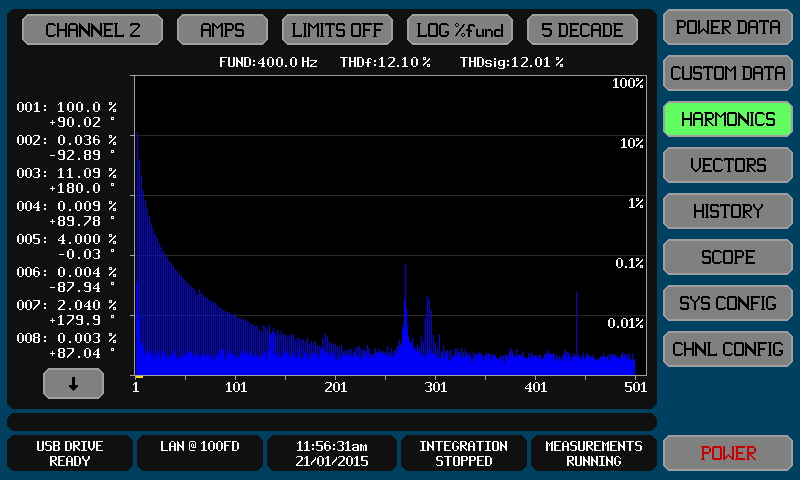
4.2 HARMON IC ANALYSIS SPECIFICATIONS
|
| Method |
DFT performed at each frequency on same set of sampled signals (there is no discontinuity throughout the analysed frequency range) |
| Window Maximum |
F> (measurement period): Hann (also called Hanning) Otherwise: Rectangular |
| Harmonic |
The smaller of –
a) A frequency of 435KHz (W type charnels) or 115KHz {otherwise)
b) 500th (harmonic over the 100th, requires option H500)
c) HARMONICS setting
d) If BANDWIDTH set to USER:0.5’setting/fundamental frequency |
| Harmonic Bandwidth |
Nominally the greater of-
a) The smaller of fundamental frequency or 2/LF PERIOD measurement period)
b) If FUND set to AVIONICS:20Hz
c) (Fundamental frequency* Maximum Harmonic/2250) |
| Measurement |
Nominally (1/Ham ionic Bandwidth) |
| Period Update Internal |
Nominally the greater of –
a) LF/PERIOD measurement period
b) Ham ionic Measurement Period {from above)
c) 0.25ms x ∑(Maximum Harmonic for each channel configured for harmonics) |
| Data Available |
Volts,Amps and Watts amplitudes for each configured harmonic
Volts and Amps as a percentage of the fundamental of the same signal
Volts and Amps THD as a percentage of the fundamental of the same signal
Volts and Amps THD as a percentage of the AC+DC am platitude of the same signal
V and A Phase of fundamental relative to the voltage fundamental of the lowest numbered channel in the VPA
V and A Phase of each non-fundamental ham ionic relative to the fundamental of the same signal |
| Accuracy |
See relevant Voltage,Current and Watts accuracy specifications |
4.3 SPECTR UM ANALYSIS SPECIFICATIONS
|
| Method |
DFT performed at each frequency on same set of sampled signals (there is no discontinuity throughout the analysed frequency range) |
| Window |
Hann (also called Hanning) |
| Frequency |
0.01Hz to 1KHz |
| Resolution |
Nominally (1/frequency Resolution) |
| Measurement Period |
minimum is 100 x Frequency Resolution |
| Maximum Frequency |
Maximum is the lowest of nominally –
a) 16384 x frequency Resolution (under some circumstances as low as B192 x frequency Resolution)
b) 435KHz (W type channels) or 115KHz {otherwise) |
| Data Available |
Volts, Amps am Watts amplitudes for each configured spectrum |
| Accuracy |
frequency See relevant Voltage,Current and Watts accuracy specifications |
4.4 CYCLE VIEW SPECIFICATIONS
|
| Signal Range |
As specifications for Voltage and Current |
2.6 FREQUENCY MEASUREMENT SPECIFICATIONS
|
| Frequency Range |
FUND setting of MAINS:45Hz to 65Hz
FUND setting of AVIONICS:300Hz to 900Hz Otherwise-
LF/PERIOD setting of VLF:0.0099Hz to 65Hz
LF/PERIOD setting of LF:0.19Hz to 1KHz
LF/PERIOD setting of 300ms period:9Hz to 305KHz (W channel type) or 80KHz (other channel types) LF/PERIOD setting of 100ms period: 19Hz to305KHz (W channel type) or 80KHz (other channel types) LF/PERIOD setting of 20ms period: 44Hz to 305KHz (W channel type) or 80KHz (other channel types) LF/PERIOD setting of 10ms period: 145Hz to 305KHz (W channel type) or 80KHz (other channel types) LF/PERIOD setting of 2ms period:495Hz to 305KHz (W channel type) or 80KHz (other channel types) If BANDWIDTH set to USER setting then upper limit is 0.5*setting |
| DC Level |
DC offset is automatically eliminated |
| Min. input (typical) |
Voltage: 0.5Vrms (W, S or A channel type) or 75m Vrms (L channel type) at fundamental Current,H option:0.05Arms at fundamental
Current,D option: 0.04 Arms (HI range)or 0.3m Arms (LO range) at fundamental Current,X option: 5m Vrms (HI-range) or 150µ Vrms (LO range) at fundamental |
| Min.Pulse Width (typical) |
Greater of-
1.25µs (W channel type) or 5µs (other channel types) 0.001% of measurement period 10% of signal period |
| Update Period (nominal) |
As shown below for FREQ SPEED settings of FAST/NORMAL/SLOW respectively – LF/PERIOD setting of VLF:greater of 1/2/15s or 1 cycle LF/
PEROD setting of LF:greater- of 1/1/5s or 1 cycle LF/
PEROD setting of 300ms period: 0.25s/O.75s/2s LF/PEROD setting of 100ms period: 55ms/250ms/1s LF/PEROD setting of 20ms period: 25ms/200ms/700ms LF/ PERIOD setting of 1Oms period: 1Oms/l00ms/300ms LF/PEROD setting of
2ms period:2ms/50ms/150ms |
| Resolution |
W Channel Type:0.000125%/Update Period in seconds Otherwise:0.0005%/Update Period in seconds |
| (nominal) Maximum |
0.01% + Resolution |
| Setting Time (nominal) Error |
Greater of (2 if significant DC content) –
a) 2 amp litude periods
b) 2 frequency measurement periods
c) 4 cycles of the signal |
3. MECHANICAL CHANNEL INPUT AND ACCURACY SPECIFICATIONS (MT TYPE)
|
3.1 INPUT CAPABILITIES AND CHARACTERISTICS
|
| Input Terminals |
SPD {Speed): BNC(Isolated from XT2640 chassis), configurable as analog or digital input TRQ (Tarque):BNC(isolated from XT2640 chassis), configurable as analog or digital input DIR (Direction) : BNC (isolated from XT2640 chassis), digital input |
| Input Common-Mode |
Up to-15VPK to + 15VPK specified
Up to-30VPK to + 30VPK with no damage |
| Analog Input Range |
Up to-12VDC to + 12VDC specified
Up to-15VPK to + 15VPK specified
Up to-30VPK to + 30VPK with no damage |
| Digital Input Range |
LO:<0.5V (nominal)
HI:>2V (nominal)
Up to-30VPK to + 30VPK with no damage |
| Input Impedance |
Each input nominally 150KΩ to XT2640 chassis ground |
3.2 DIGITAL INPUT MEASUREMENT SPECIFICATIONS
|
| Digital Frequency Timing |
Signal must be LO for >500ns
Signal must be HI for >500ns
Frequency measurement up to 500KHz {typically 900KHz)
Minimum measurable frequency limited by user set measurement period |
| DIR Setup/Hold Timing |
DIR must best-able for >550ns prior to and after active edge of SPD input |
| Maximum Frequency Error |
Measurement Period >10ms: 0.01%
Measurement Period <lOms: 0.015% |
| Cycle Period Time |
From 2.3us (W type channels), 8.7us (otherwise) up to 100 seconds |
| Resolution Method |
1/512th of a cycle |
| Maximum Error |
Mean cycle formed by asynchronously sampling all cycles within measurement period
As Voltage and Current Specifications tor PK data 011/atts = multiplication of V and A waveforms) |
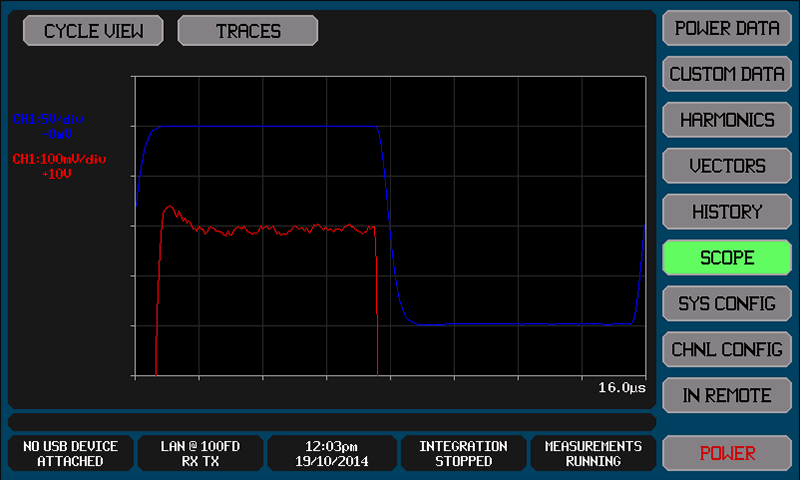
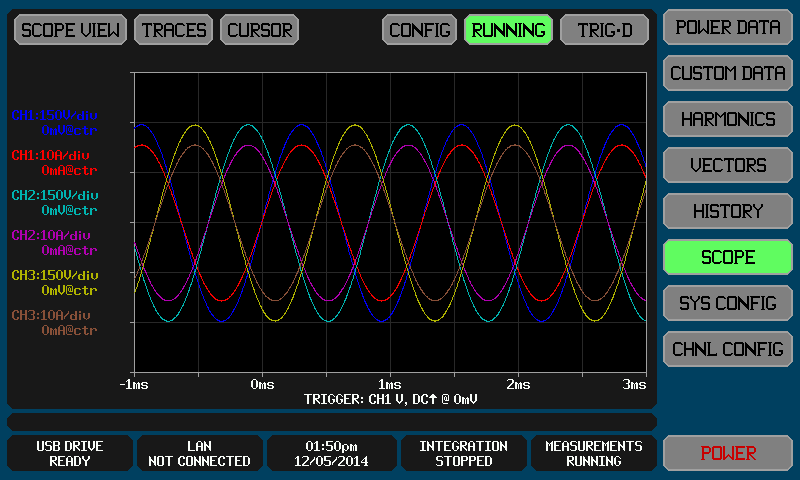
4.5 SCOPE SPECIFICATIONS
|
| Signal Range |
As specifications for Voltage and Current |
| Timebase |
1/2/5 settings from Sus/div to 20s/div |
| Capture Depth |
Up to 32k points per signal |
| Capture Resolution |
<0.00005% of specified maximum measurable peak Voltage or Current |
| Sampling Period (nominal) |
Greater of –
1.1µs 011/ type channels) or 4.1µs
(otherwise) 0.03% of timebase setting |
| Maximum Error |
As Voltage and Current Specifications for PK data 011/atts = multiplication of V and A waveforms) |
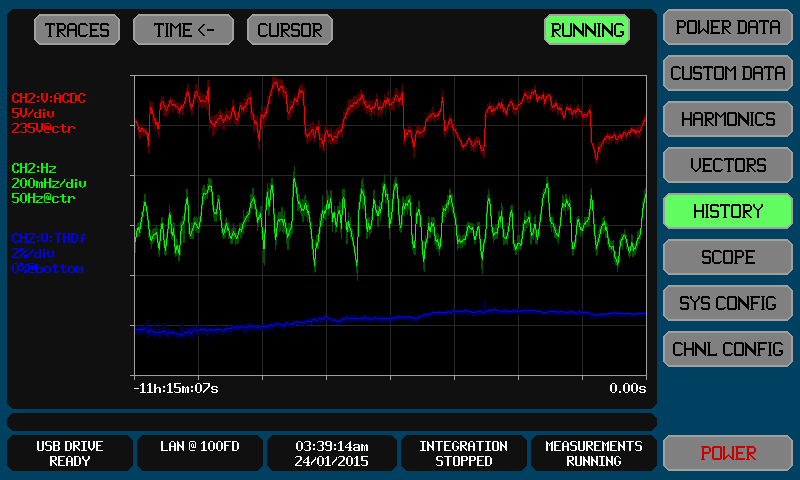
4.6 HISTORICAL DATA COLLECTION SPECIFICATIONS
|
| Collection Time |
Automatically continuously variable between 1 measurement period and 584.5 million years (collection is automatically stopped after this time has elapsed but this is untested at the time of writing) |
| Time |
Note: this is the resolution by which you can determine when an event occurred, not that of the XT2640 detecting events. All events are captured. |
| Resolution |
The greater of-
a) 1 pixel of displayed data (front panel) or 1 increment of the requested time interval (interface)
b) 1 measurement period of the data being recorded
c) A maximum of 1/4096th of the elapsed historical data collection time (typically 1/8192th). |
| Data Capture |
Every measurement is included in the maximum, average and minimum data tor each increment of the time resolution interval regardless of the time resolution. |
4.7 DATA LOGGING SPECIFICATIONS
|
| Logged Measurements |
Up to 16 measurement data per record (each of which can be 1 measurement or up to 500 harmonic measurements) |
| Data per Record |
Up to 8003 data per record |
| Internal FIFO |
32Mbyte (always in binary format, 4 bytes per data) |
| Buffer Internal |
>2Gbyte (always in binary format, 4 bytes per data) non-volatile Typically |
| Memory |
5Mbytes/sec maximum sustained mean write rate |
| External Data File Format |
ASCII (CSV, scientific format) or Binary |
| Timestamp |
Record number + optional date and time (1 second resolution) |
| Maximum File Size |
4Gbyte |
| Maximum Records |
Only limited by maximum file size |
| Start Delay Time |
Zero to 99 days, 99 hours, 99 minutes, 99 seconds (1 second resolution) 0.01% + 8ms maximum error |
| Run Time |
Manual (unrestricted period of time), or 1 second to 99 days, 99 hours, 99 minutes, 99 seconds (1 second resolution)
0.01% + 8ms maximum error |
| Log Interval |
0.002 second, or 0.01 second to 99 hours, 99 minutes, 99.99 seconds (0.01 second resolution) 0.01% maximum error ± 2ms non-accumulating error |